100% Hosted in the eu
One of the most common questions during an implementation is: how do I show my manager or board where we stand? ISOPlanner™ includes built-in reporting that gives you a clear, presentable overview of your compliance status at any moment. No manual slide building, no data exports. Open the report and share the view.

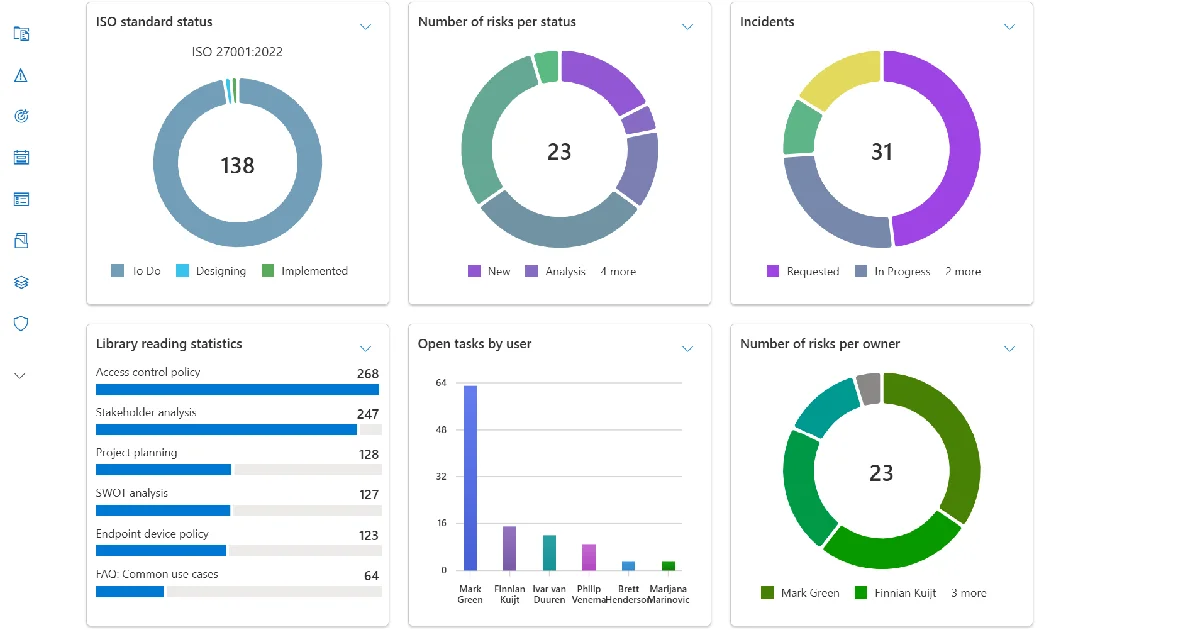
Your full risk landscape in one view. Linked controls, findings, non-conformities, and incidents. Period comparison shows how your risk profile has shifted over time, so you can demonstrate progress, not just current state.
See at a glance which controls are effective and which are flagged. Built directly from findings, non-conformities, and incidents linked to each control. No manual status updates needed.

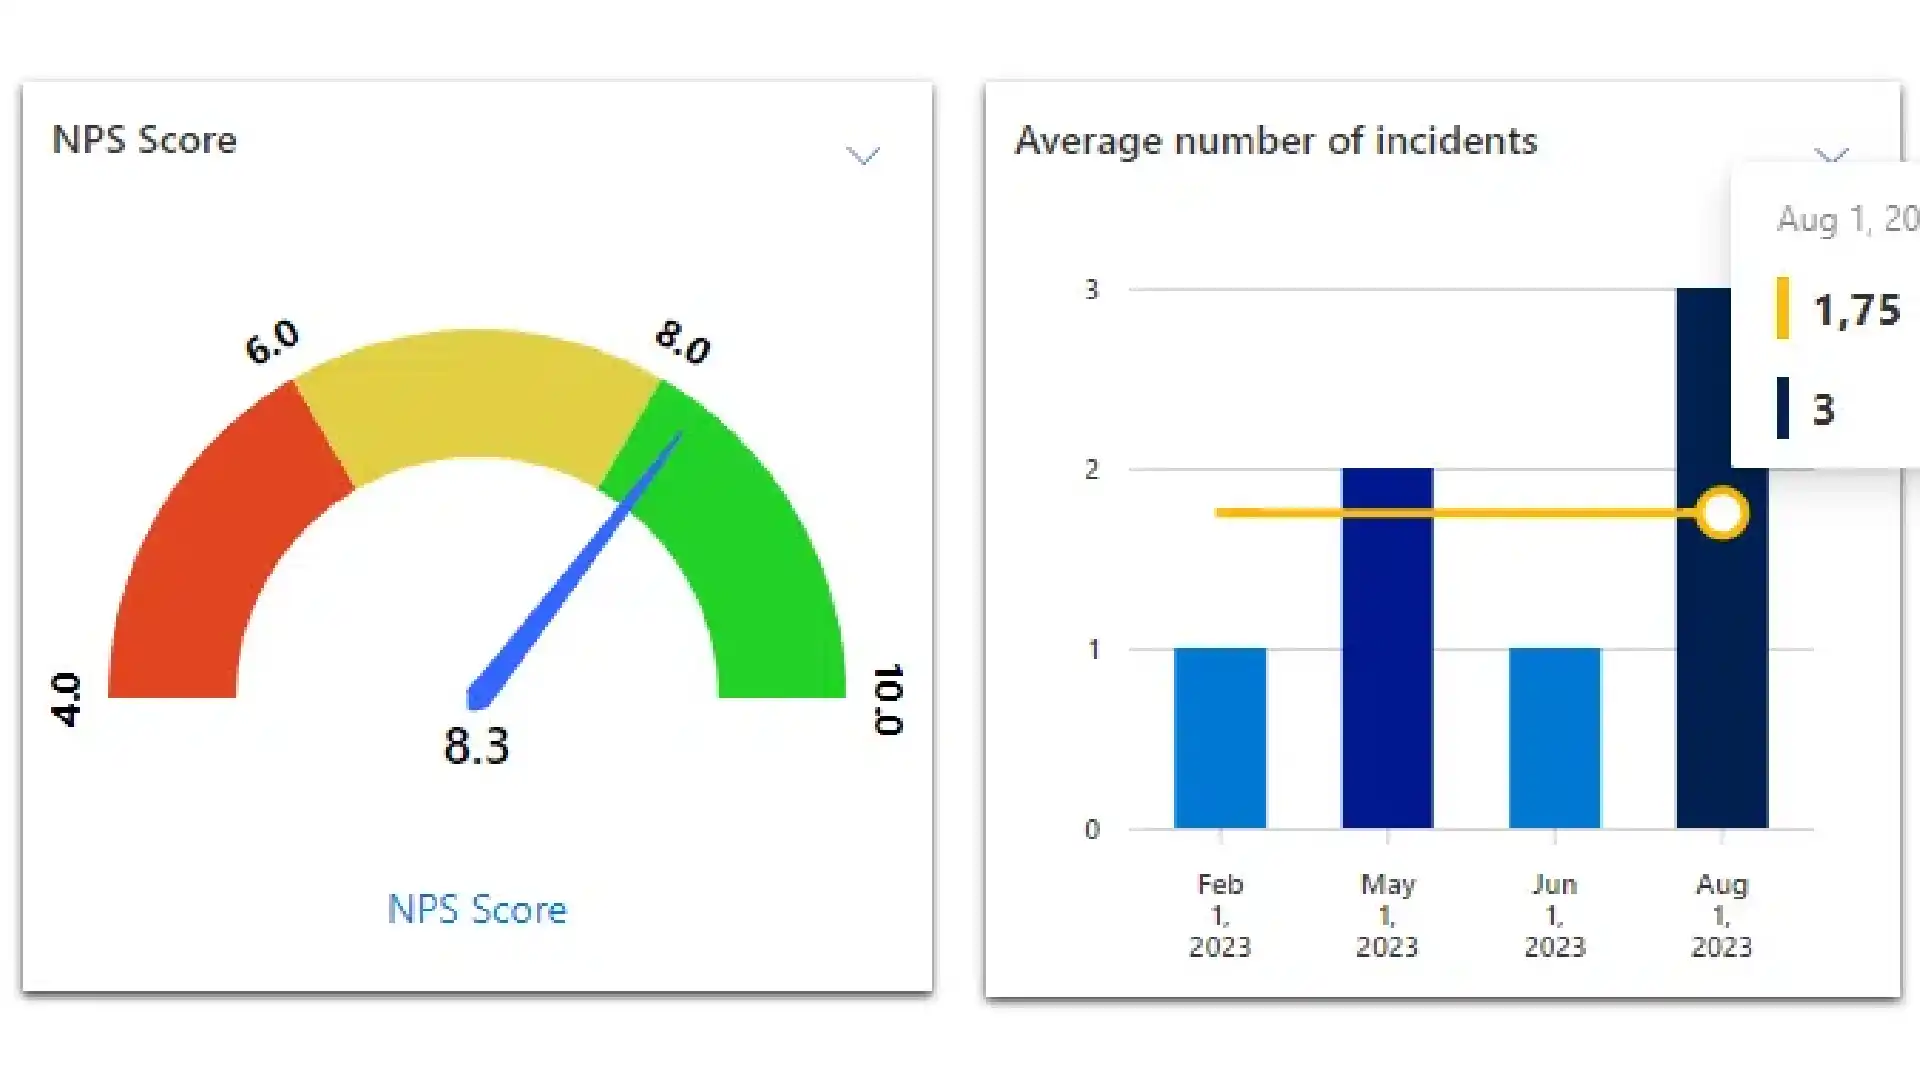
Define objectives and set the KPIs that measure them. Crossing a threshold triggers a dashboard alert. Track progress over time so you can show direction, not just where you stand today.
Need to bring compliance data into your existing business intelligence environment? ISOPlanner™ connects to Power BI. Compliance status feeds into your executive dashboards automatically, alongside the rest of your business data.

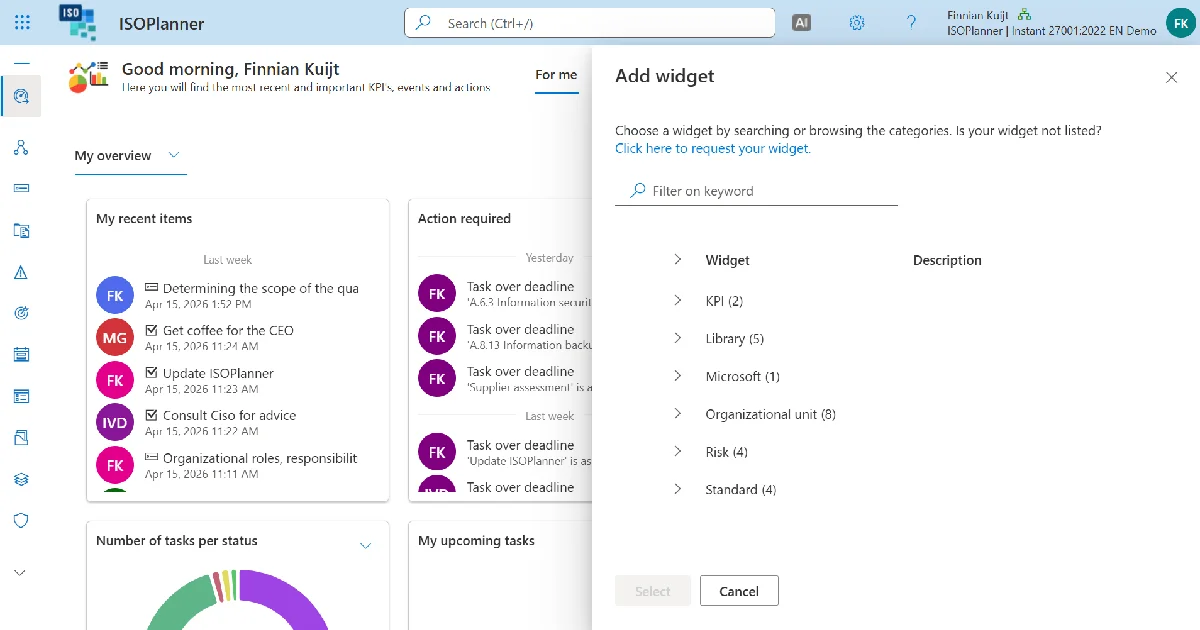
Every dashboard is built from a configurable set of widgets. Choose what each audience sees and arrange them to fit their focus. No coding required.
Available widgets:
• Overdue tasks summary
• Current tasks
• Important documents
• Implementation progress tracker
• KPI threshold alerts
Dashboards work at three levels: personal (individual tasks and deadlines), team (department activity and completion rates), and organization (top-level compliance posture and objective progress). Each level shows only what is relevant to that audience.

01.
What types of dashboards does ISOPlanner™ provide?
ISOPlanner™ includes seven dashboard levels: personal (individual task load and deadlines), team (completion rates and activity), organization (top-level compliance posture and KPIs), process (KPI performance and control status per business process), objective (progress toward defined goals), risk (risk landscape and trends), and control (execution history and effectiveness rating).
02.
Can dashboards be customized per audience?
Yes. Dashboards are assembled from a widget library including overdue task summaries, KPI threshold alerts, risk heatmaps, implementation progress trackers, and control effectiveness summaries. A process owner's dashboard looks different from a board-level executive view. No coding required, and each audience sees only what is relevant to them.
03.
How does ISOPlanner™ track KPIs and objectives?
You define organization-level objectives and the KPIs that measure progress toward them. Each KPI has configurable thresholds that trigger alerts when crossed. KPI data is stored as a time series, so trend views show direction over time, not just a current snapshot. Period options include last month, audit year, or a custom date range.
04.
What does the risk dashboard show?
The risk dashboard includes the full risk landscape, linked controls, findings, non-conformities, and incidents. A period comparison shows how the risk landscape has shifted relative to the previous review period, so leadership sees trends rather than a point-in-time snapshot.
05.
What does the control effectiveness dashboard show?
The control dashboard opens with a fixed effectiveness section built from tag categories that aggregate findings, non-conformities, and incidents linked to each control. You see whether a control is working before reviewing its scheduling history. This gives a clearer picture than completion rates alone.
06.
Can ISOPlanner™ data be exported to Power BI?
Yes. ISOPlanner™ exports data to Power BI for custom executive dashboards with automatic refresh. Teams that already use Power BI for business intelligence can add compliance status to the same environment, using the same access controls already in place.
07.
Are all dashboards available on all plans?
Core dashboards are available on Business and Premium plans. Power BI integration is available on the Premium plan. Custom KPI tracking and objective management are available from Business plan onwards.


Log in to your ISOPlanner™ workspace, or start a free trial.
Log in Start your free trial